

Concentration of mortgage loans: Romania at two speeds
According to the latest Financial Stability Report published by the National Bank of Romania in June 2026, over 60% of new mortgage loans granted to the population go to just 10 counties in the country. This polarization is not new, but it has intensified in recent years, along with price dynamics and internal migration towards major university and economic centers.
BNR already showed in the 2023 report that six regional centers concentrated approximately 60% of the total stock of mortgage loans, of which București Ilfov alone held about 35% of the volume. This concentration has remained structural, even if growth rates differ from one county to another.
Over 60% of new mortgage loans go to just 10 counties, and about one third of banks’ exposure to housing is in București Ilfov.
Banks’ exposure on the residential segment remains significant. In March 2026, mortgage loans and consumer loans secured by mortgage represented around 61% of total loans granted to the population, according to data summarized by BNR for the economic press. In this context, the geographical map of mortgage lending becomes essential for all market participants.
Which counties are driving the market: beyond București and Cluj
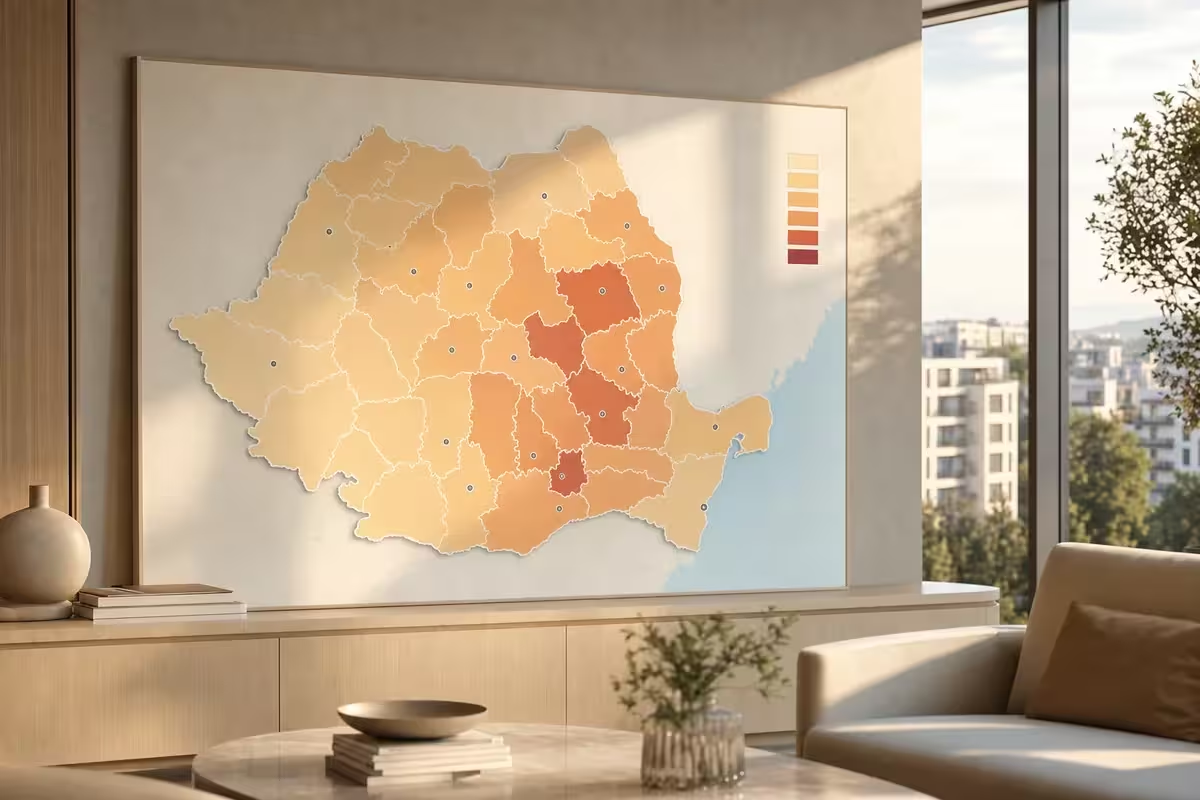
Data from ANCPI and analyses conducted by various specialized platforms clearly show that, when we talk about transaction volume and mortgages, the same group of counties consistently appears at the top. For the entire year 2025, ANCPI reported over 628,000 properties traded nationwide, and București, Ilfov, Cluj, Timiș, Brașov, and Constanța ranked among the leading positions by number of transactions.
A specific example: in June 2026, ANCPI recorded 51,808 transactions nationwide, over 2,600 more than in June 2025. București and Ilfov dominated the ranking, and counties such as Cluj, Timiș, and Iași confirmed their status as regional hubs with high volumes of sales and lending.
Based on ANCPI data broken down by county and market analyses, the counties that recurrently appear at the top by transactional activity and residential lending include:
- București and Ilfov, where both the highest number of transactions and the highest number of new mortgages reported monthly are concentrated.
- Cluj, with a large volume of transactions and a high share of credit-financed purchases, against the backdrop of high average prices.
- Timiș and Brașov, counties with mature markets, where demand comes both from residents and from buy to let investors.
- Constanța, with an important seasonal component and a significant share of investment transactions.
- Iași, which in recent years has increasingly and firmly entered the “heavyweight” league in terms of transaction volume and mortgage dynamics.
In February 2026, for example, the number of mortgages registered nationwide was 24,838, and the highest number of such operations was in București, Ilfov, and Timiș, according to ANCPI data made public.
The risk map: Ilfov versus Cluj and differences in loan quality
An important element from the perspective of investors and developers is the quality of the loan portfolio by county. In its March 2026 reporting, BNR signals that there are significant differences between counties in terms of the non performing loan ratio in the mortgage segment.
In Ilfov county, where the level of residential development has been very high over the last decade, the non performing mortgage loan ratio is around 1.8%. In Cluj county, the NPL ratio is approximately 0.7% for mortgage loans, which indicates a more moderate risk profile relative to price dynamics and the high level of lending.
For the population as a whole, BNR shows that, while the NPL ratio for non financial companies rose to 5.6% in March 2026, the quality of the loan portfolio granted to individuals improved slightly compared to the previous year. This distinction between households and companies is important, as it shows that, for the time being, systemic risk does not stem from the area of mortgage lending to individuals, but rather from other lending segments.
At the same time, BNR continues to consider household real estate lending as a channel through which a potential shock on the residential market could be transmitted to the banking sector, which is why it imposes stricter prudential rules on loans for a second home and on loans with low down payments.
What these data mean for buyers, investors, and developers
The geographical concentration of mortgage loans and the differences in the quality of banks’ portfolios are not just statistics. They should influence purchase, investment, or development decisions.
For buyers and tenants, a few useful conclusions:
- In highly leveraged counties such as București, Ilfov, Cluj, or Timiș, prices have a larger “price of access to credit” component, not just an economic fundamentals component. Any tightening of lending conditions can translate more quickly into price corrections.
- The lower non performing loan ratio in counties such as Cluj suggests a generally stronger borrower profile and better payment discipline. This can support price stability in moderate stress scenarios.
- In counties with higher NPLs, such as Ilfov, the risk of price adjustments may be more pronounced in certain micro markets with excessive development and insufficient infrastructure.
For investors and developers, the map of housing bankarization is a planning tool:
- Areas with a large volume of new mortgages and low NPLs indicate markets with solvent demand, where well positioned projects have a high chance of being absorbed, even if the pace may temporarily slow.
- Areas with rapid increases in the number of mortgages, but with still limited urban and social infrastructure, may conceal oversupply risks. Examples of increases of over 30 40% in mortgages in some counties in recent years are worth closely monitoring in relation to housing deliveries.
- Less bankarized markets, especially in counties with growing economic potential, may represent medium term opportunities, but with a longer maturation timeline and a higher share of transactions financed from own resources.
In all scenarios, interest rate sensitivity remains a key factor. BNR showed in the June 2024 report that the average interest rate on mortgage loans in lei was around 8% in March 2024. Even if the monetary policy trajectory started to reverse afterwards, the level of interest rates remains higher than in the 2016 2020 period, which limits borrowing capacity and tempers exuberance in the market.
How to use the mortgage credit map in your decisions
Whether you are a buyer for your own use, an investor, or a developer, a few practical recommendations can help you put BNR and ANCPI data into context:
- Check ANCPI statistics by county and by month on a regular basis, both for the number of transactions and for mortgages. A rising trend in mortgages accompanied by a slowdown in transactions may signal a tightening of the price income ratio.
- Correlate BNR data on non performing loans with local indicators, such as the vacancy rate in the rental segment or the number of new projects launched. A market with rising NPLs and a large stock of new housing can become fragile.
- In București Ilfov, analyze separately by sectors and neighboring localities. The risk profile of areas with new houses in the south of the Capital is not the same as in the north or west, even though they all fall under the same county statistic.
- For long term investments, prioritize counties where transaction growth is coupled with investments in infrastructure, universities, industrial parks, and services. These are the factors that support real demand, not just temporary access to credit.
In the short term, BNR’s message is clear: risks to financial stability remain high in the context of internal imbalances and external uncertainties, but the segment of mortgage lending to households is not, at this point, the epicenter of the problem. That is precisely why, for residential market participants, this period is one for refining strategies, not for panic.
Sources
Întrebări frecvente
Why does it matter that over 60% of new mortgage loans are concentrated in 10 counties?
Because it shows that market risk is strongly localized. If price corrections or payment problems occur, they will disproportionately affect the areas where the most credit has accumulated, especially București Ilfov and the major regional centers.
Is it riskier to buy with a loan in Ilfov than in Cluj?
Not necessarily at the individual level, but statistically the non performing mortgage loan ratio is higher in Ilfov than in Cluj. This suggests that some micro markets in Ilfov are more vulnerable to interest rate or income shocks. That is why specific analysis of the area and the developer is important.
How can I check myself whether the county where I buy is over leveraged?
You can follow ANCPI releases every month for the number of transactions and mortgages by county, and then consult BNR reports on non performing loans and geographical concentration. By comparing the dynamics of transactions with that of mortgages and price developments, you can get an idea of whether the market is tight or balanced.
What should a developer look at when choosing land in a new county?
Beyond the land price, it is important to analyze the level and dynamics of mortgages, the NPL ratio in the area, public investment in infrastructure, and net migration to the locality. A market with low volume but gradual growth may be healthier than one already saturated with new projects and credit.
How do high interest rates affect the mortgage lending map?
High interest rates reduce borrowing capacity, especially in cities with high prices. Consequently, some marginal projects may become unaffordable for target clients, and developers redirect towards more efficient products or towards markets where the price income ratio is more balanced.